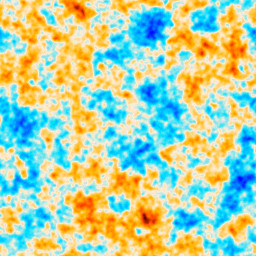
For the first 400,000 years after the Big Bang, the Universe was filled with hot, dense plasma that was opaque to light. As the Universe expanded, the plasma cooled and thinned out, becoming transparent. The last-scattered light appears as the cosmic microwave background (CMB). The Planck satellite has been capturing the variations in the brightness of the cosmic microwave background over the entire sky at the highest precision ever achieved.
Normal matter - The stuff you see around you: tables, buildings, planets, stars, etc.
Dark matter - Cold, dark, matter can not be seen or felt, and has not been detected in laboratories. Its gravitational influence can be seen in the rotation of galaxies. It is called "dark" because it doesn't give off light.
Dark energy - Dark energy exerts a kind of pressure that is causing the expansion of the Universe to speed up. It is called "dark" because we don't know what it is.
A power spectrum is a mathematical function that can be used to describe the distribution of a quantity (any quantity) in space. This concept can be illustrated by considering a city with a variety of buildings in it and assessing the different types of people that live in each type of building. A survey like this might start with counting how many buildings there are of each size: how many one-family houses, how many two-family houses, how many skyscraper blocks, and so on. It doesn't matter if, on an individual street, there is a tiny one family house nearby a huge apartment block – what matters is how many of each size of buildings there are in the overall architecture of the city, to study how this influences the behaviour of the population. Plotting the number of buildings as a function of their size is an example of what it means to ‘measure the power spectrum’ of the city's urban development.
When cosmologists study the formation and evolution of cosmic structure in the Universe, they do something very similar to the analysis of the city's urban structure: they plot the relative number of cosmic structures on different sizes in a power spectrum. The shape of this graph reveals the ‘power’ of structures that populate the Universe on each scale. For example, there may be very few structures at very large scales. But counting all of these very large structures’ contributions together gives a measure of their cumulative power. If the power is to be matched with only smaller structures, a much larger number of them are needed.
Cosmic structures – stars, galaxies, galaxy clusters – grow under the influence of gravity, which causes them to become denser and denser. However, other forces may act against the attractive pull of gravity; for example, the expansion of the Universe or radiation pressure – the pressure force exerted by photons. Every structure that we observe in the Universe is the result of the balance between all these effects during the infancy of the Universe. To understand how exactly all of these structures emerged from the almost smooth distribution of matter in the early Universe, it is important to know how many structures of each size there are in the Universe at the present epoch, and how many there were at past times in cosmic history – information that is summarised in the power spectrum.
The simplest model of inflation predicts that at the end of this phase of accelerated expansion (inflation) the fluctuations present in the density of matter are such that their contribution is almost independent of their scale. This means that the cumulative power of all fluctuations of a given scale is the same. Taking the example of the size of buildings in a city, this would mean that, if there is a given number of large apartment blocks, there should be a higher number of smaller, double-family houses and an even higher number of even smaller, single-family houses, to keep the buildings on all scales having the same ‘power’, that is, equal numbers of people living in each kind of structure.
If fluctuations in the distribution of matter in the primordial Universe have equal power on all spatial scales, cosmologists say that their power spectrum is 'scale-invariant'. This is characterised with a parameter known as the spectral index, ns. For a perfectly scale-invariant spectrum, ns = 1. If ns is smaller than 1, it means that fluctuations on larger scales are dominant, since they are more abundant (in terms of their cumulative power) than those on smaller scales; vice versa, if ns is larger than 1, fluctuations on small scales are the dominant ones.
The fluctuations in the temperature of the cosmic microwave background (CMB) are a snapshot of the distribution of matter at a much later cosmic epoch than inflation, as they date back to 380,000 years after inflation ended. In the meantime, the distribution of matter (the power spectrum) at small scales has been modified, but at very large scales an imprint of the original power spectrum that derives from inflation is still present. In particular, CMB fluctuations on very large scales carry information about the primordial spectral index ns and allow cosmologists to constrain the distribution of fluctuations as it was at the time of inflation. Furthermore, by measuring the spectral index and how much it is different from ns = 1, cosmologists can learn how long the phase of inflationary expansion lasted and how it ended, before the slower expansion rate began. The end of inflation is a particularly interesting epoch in cosmic history, because it is at this time that particles of matter were created for the first time.
The Planck satellite - a European Space Agency (ESA) mission launched in May 2009 - has surveyed the entire sky to search for the origin of the universe. One of the most technologically advanced satellites ever launched, its first cosmological results were released in March 2013.
This CMB Simulator was created for the Royal Society Summer Exhibition 2013. The CMB Simulator code is on GitHub. The simulated power spectrum data are from CAMB.